Greets###
As a measuring experimenter with a homebrew POV, I like to add new test equipment and procedures to my lab each year. With digitally processed spectrum analyzers getting more able and relatively cheaper over time, I think a spectrum analyzer (with a built in tracking generator) might prove one of the best toys to consider buying. As ever, a homebrew SA remains a valid option for more advanced builders.
A bench experiment challenges us at many levels: we'll often combine equations + calculations, intuitive analysis and quality measures to advance our understanding of what's going on inside these little silicon parts. Best of all, we gain the experience, confidence and know-how that may allow us to interpret phenomena outside our comfort zone.
Over time — applying curiosity and effort, we acquire and get to enjoy a small arsenal of analytic methods at both AC and DC: For example, measuring drain current, or transistor beta — or perhaps learning small signal analysis using hybrid parameters, or making return loss measures, inferring resonator Q, or measuring magnitude and phase (vector analysis). 3 other measures rank highly important to me: 2 tone intercept techniques to assess IMD, noise figure and phase noise. The latter 2 may take awhile, but I'm sure I'll get there.
IIP3 in Mixers
Pretty much everything about IMD measures we need to know lays in the pages of EMRFD Chapters 2 and 7. Further; many have written web sites or tutorials to help us. 1 great example is Rob, KD6OZH's
Mixer IMD Page
As a new builder, I initially felt surprised that we needed to learn about both non-linear and linear behavior in AC circuits. Now I know better. Non-linear conditions like saturation, compression, crossover, intermodulation, plus other species of non-linear phenoms such as IMD in higher level (passive) LC circuits can lead to distortion and/or noise that may be quantified or inferred to aid design and understanding.
Much of this flies over my head. I measured the IIP3 of an ADE-1 mixer to learn the ropes.
I won't go into IIP3 definition and theory — it's been done by those much smarter than I.
In the mixer IIP3 context, this
MCL file really helped me.
Let's explore the needed parts and set up for mixer IIP3 measures:
Test Equipment
- 3 low noise signal generators
- A combiner such as a 6 dB hybrid (your HF-VHF return loss bridge)
- Attenuators
- Cables and 50 Ω connectors
- A 50 Ω detector -- I'll use a spectrum analyzer
- A device to test: ADE-1 mixer or....
Please know, I'm showing these experiments to foster discovery and discussion — and to document some early experiences. I don't go into a comprehensive diatribe or even show the best way to go : just 1 method to get it done. Our test equipment varies widely and you'll have to determine what works best for you in your lab.
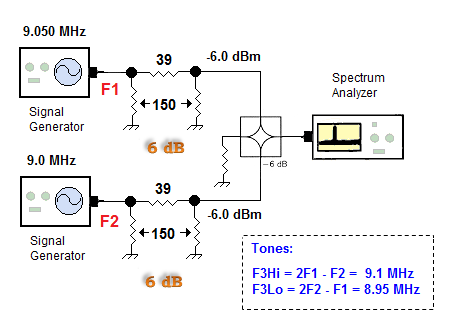
I'm going to insert 2 tones into the RF port of an ADE-1 mixer: 9.00 MHz and 9.050 MHz. I tried a 20KHz, 50 KHz and 100 KHz tone spacing and when the mixer was assessed wideband (without a xtal filter after it), I found the exact tone spacing made little difference to the IIP3 within reason.
Above: My bench setup. The first order of business in IIP3 measurement is to assess the input intercept of your basic measurement apparatus. You should not see distortion on your spectrum analyzer screen — if so, eliminating this distortion is job #1. I learned that if you drive the SA too hard, you just might measure the IIP3 of your SA!
To clarify. Your injected tones can create IMD products on your SA screen and we need eliminate these so we only measure the intercept of the device under test. Correspondence with an EE who measured intercepts with a very excellent Agilent SA that sells for many 10's of thousand dollars yielded insight. He found input intercept products may show up when driving that SA input with signals hotter than -20 dBm. This could also happen with a much cheaper SA. Judicious use of input attenuators will solve these woes and I'll show some experiments that demonstrate this.
The 9.050 MHz signal generator = a very low phase noise device [ tested by an engineer at -140 dBc @ a 20 KHz offset ]. The 9 MHz signal came from a homebrew LC signal generator ( EMRFD Figure 7.27) assumed to also exhibit low phase noise. The 6 dB hybrid combiner is Figure 7.41 from EMRFD.
I tested my basic setup with a variety of powers from the signal generators. For example: -10 dBm, 0 dBm or 10 dBm. With the various signal generator powers, I got the most consistent measures with a 6 dB pad connected to each SG output.
This in theory assures that 1 signal generator would be 18 dB down in output of the opposing signal generator and prevent them "talking to" or modulating each other during measures with higher signal generator power. I've since standardized these 6 dB pads in my personal intercept procedure. I typically run the 2 generators at 0 or - 10 dBm and insert at least 20-25 dB of attenuation on the spectrum analyzer input. Setups may vary and your experiments will guide you.
Above — My 2 injected tones and "grass".
Love this. I saved this spectrogram to file with 20 dB SA attenuation switched in plus an external SMA 5 dB pad threaded on the SA input. Compare this to the transfer function below. I’m trying to keep the 2 tones around -20 dBm.
Above — Spectrogram with 25 dB SA attenuation switched in and no external 5 dB pad. Look — 3rd order products emerged from the noise @ 50 KHz out. Same input attenuation as above: but why the difference?
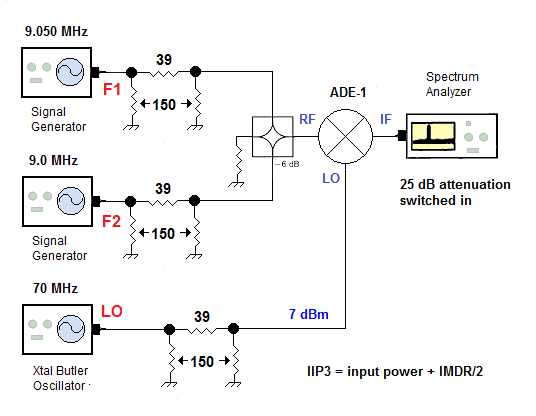
Above — ADE-1 mixer and 70 MHz LO added. The available power at the mixer RF port = -12.21 dBm and was used for all IIP3 measures shown. My 70 MHz LO signal came for a 3rd overtone Butler oscillator with serious buffering, a low-pass filter and a 6 dB pad to help ensure measurement fidelity.
Above — The mixer IIP3 measure. Wes shares the calculation as Equation 7.2 in EMRFD: IIP3 (in dBm) = Input power (dBm) + IMDR (dB) / 2 . My IMD ratio from above = 62.09 dB so IIP3 = -12.21 dBm + (62.1 dB/2) = 18.8 dBm. Now let's try with that external 5 dB pad connected and 20 dB of SA attenuation switched in:
Above — 5 dB external padded and SA internal attenuator set to 20 dB.
Above — IIP3 = -12.21 dBm + (60 dB/2) = 17.8 dBm. The 1 dB power difference between this and the previous measure is about the power resolution of many spectrum analyzers.
Above — External 5 dB pad removed and SA attenuation switched to 30 dB. IIP3 = -12.21 dBm + (58.95 dB/2) = 17.3 dBm. Switching the internal attenuator to only 10 dB caused all manner of noise and products to emerge and IIP3 results were inconsistent when testing various devices.
I'll stop here since more than anything these experiments show you'll need to experiment to find a consistent technique for your measures. The real beauty of IIP3 or its cousin OIP measurement comes from the math. We can input intercepts into equations or programs to determine the performance of a system — i.e. you measure individual stages and then design a complete receiver or a transmitter and enjoy the fruit.
At the very least, intercepts serve as figures of merit that allow us to compare, or to meet or beat our design goals. In the case of beloved amplifiers, we can measure stuff like gain, return loss, OIP3, gain compression and really get a handle on what we're stuffing onto a circuit board.
Thanks to my mentors and to Jason, NT7S for his measure comparisons and thoughts on mixer IIP3 measurement.
More
During these experiments, I also advanced my wide band FM receiver design and made a few new bench modules. Here's a dash of pictures:
Above — 1 version of my ADE-1 mixer under test. This build features a diplexer on the IF port. On my first version I ran inductors wound on FT37-10 toroids for the diplexer, but the resonator Qu was only 85.7 so I substituted air wound coils. The diplexer boosted IIP3 by about 2 dB.
I bolted the SMA connectors onto the mixer circuit board. The green breakout board is well soldered to the copper ground plane at 6 points.
Above — I built a bench module low-pass filter for 50 MHz using an ARRL handbook + Ladbuild and GPLA from the EMRFD CD. The cursor is ~set at the 3 dB frequency
Above — A TG + SA sweep of the filter breadboard showed that the "2nd harmonic": 100 MHz lies ~ 61 dB down. OK, it's a keeper.
Above — The boxed up and mislabeled LP filter. The 3 dB or half-power frequency is actually 51 MHz — still the ladpac software simulated pretty close considering 5% capacitors, inadvertent coil mounting changes and stray reactance. I soldered the parts right onto a solid copper ground plane.
Above — An 88 --108 MHz double-tuned filter with green coupling wire. I later changed the coupling, but in all cases double humped the response and then lightened the coupling while watching the 3 dB or half-power bandwidth, insertion loss and S11-S22. With the TG and SA plus a return loss bridge, you can sweep the input/output return loss and gain valuable insight.
I simply love frequency domain measures — and I'm a 'scope guy!
Best!


 = 17.8 dBm.")


