Hello!
A reader saw a photo of my old W7ZOI crystal
characterization oscillator (with the suggested switch from Dr. Gordon-Smith, G3UUR)
in the site archive. I had removed its
crystal holders to yet another such oscillator and just soldered in a crystal
as a PROP for the photo. This photo "suggested" it was OK to solder in the
various crystals under test.
The reader found
serious temperature drift during crystal frequency measures and then emailed
me with deserved concern. Yikes. My bad — I
apologize. Securing a crystal under
test in its holder must never involve heat. Wes, W7ZOI even puts a crystal into its
holder while wearing gloves to minimize body temperature effects.
I prefer to characterize crystal motional L and C with the G3UUR formula and measure C0 with a LC meter. For Qu, I'm adopting Wes' series trap method shared in EMRFD Chapter 7. I'll blog my humbling Qu experiments after this introductory bit.


Above — 3 photos of an actual oscillator I've used to characterize crystal motional parameters. In the third photo I replaced the gimpy toggle with a slider switch. Studying the effects of switch types might require experiments, however, I've learned that switch lubricants may affect measures. Regardless, the C of the toggle switch plus the 33 pF fixed series capacitor get accommodated in the calculations.
The ultimate switch might include the latching microwave relays like those found in the K2 VCO, or perhaps small pin bridging connectors like those found on motherboards? Building on a single-sided Cu board seems prudent to avoid unwanted Q side effects.
My alligator clip crystal holders might not rank as rave stuff, but they've worked well for me from 2 - 12 MHz. I'm not a builder known for handsome breadboard techniques — I'm more a framing carpenter: but hope to grow in my understanding of component-level engineering over time.
A new circuit with the the holders for the xtal + capacitor & shorting bar built above a copper ground plane is under development. This fixture uses a tracking generator plus spectrum analyzer to get the values needed to calculate Lm with the G3UUR formula. Further, an IL measure and 3 dB measurement will provide ESR and Qu. "One and done" it will be!
I need to characterize some xtals for the 30-40 MHz crystal ladder IF filters in my future NBFM receiver experiments. I'll share all these experiments in the future.

Above — My current oscillator schematic. The original version by Wes shown in EMRFD works great and I recommend it . The 2 Colpitts caps should be >=10 times the series 33 pF, so my 390 pF caps work OK. I added a green "power on" LED with a 1K current limiter resistor in my build.
Most of my lower current DC power supplies connect to my breadboards via RCA jacks. This helps prevent DC supply alligator probe shorts during experiments involving many components. Whatever works.

Above — Measuring the capacitance of the open switch plus the 33 pF fixed value cap wired in-situ. This will give you the total circuit capacitance of the open switch, the 33 pF fixed value capacitor, and any stray capacitance from your crystal holder, wires, etc. The switch itself plus stray wiring will be a few pF so the total should be 36 to 40 pF or so.

Above — My open switch total circuit capacitance.
Qu Method
Whenever I write about crystal characterization, I spark passionate emails. I've read it all — "gotta use a VNA" , "there's a better way to measure crystal holder capacitance", "...run a VXO signal generator", "you should use this program, or that fixture". All are good comments and appreciated.
I think we're lucky to have so many crystal ladder filter experts in our midst.
Certainly, professionals measure crystal parameters with network analyzers, however, we amateurs could debate this forever. Gear and measurement techniques change over time. Digital boxes keep getting cheaper to make, write code for, or buy: even the new Ham down the street bought a VNA to match his antenna. I had to show him how to use it though.
The proof of the pudding lies in in your filter breadboards. Sticking measures/values such as Lm into a program should result in a build that matches the simulated transfer response. If you make and then confirm a good filter; all is well!
Sometimes standard value capacitors, or matching errors from stray L and C, or the lack of shielding may produce extra ripple, or reduce the stop-band response and/or boost insertion loss. Then, too, we sometimes have to make a narrow filter with low Q crystals and suffer high insertion loss because we can't find better xtals at the time.
Instrument accuracy, measurement quality and arithmetic errors also factor. My gear gets calibrated regularly and it costs me dearly. I know a "expert" builder with old, crusty gear who never pays for professional calibration and then goes off on a new builder because he rounded too much during calculations.
Do your best — forget the folklore — relax, and enjoy your test bench. A desire to know, grow and learn brings its own rewards. I've mentioned this before: ours is often a difficult, frustrating hobby.
Do your best — forget the folklore — relax, and enjoy your test bench. A desire to know, grow and learn brings its own rewards. I've mentioned this before: ours is often a difficult, frustrating hobby.
Whatever method you characterize your crystals with — it should match your budget, skill and needs.
Measuring Qu
Qu or Unloaded Quality Factor in RF tuned circuits and filters can help with simulations and breadboards alike. I'll show an early attempt to measure crystal Qu. We enjoy a few methods for Q and Qu — enough, at least, to make it a fun challenge.
To preface, I recently bought my first non-home brew signal generator. It's old, but accurate, low noise, and freshly calibrated for I'm on a mission to run a 3 GHz bandwidth lab. A signal generator plus tracking generator/spectrum analyzer will serve as the main signal power measurement instruments as I move well above HF.
In part, wishing to improve my measurement techniques with this gear informed my choice of Qu measurement technique.
I examined a 4.0 MHz crystal from a batch of 10 "high quality, well matched crystals" purchased in 1996 from a reputable vendor from Germany. To my delight, I found 6 within ~10 Hz frequency and built a N=6, 500 Hertz wide CW filter with 0.1 dB ripple and an IL ~1 dB.
Here's the crystal motional L and C measures plus C0 of a remaining, unused crystal:

I've learned that Z0 is the critical piece. I got better data by threading a SMA 10 - 15 dB attenuator pad on either side of the crystal to boost measurement fidelity.


Big thanks to all those greats who pioneered crystal measurement and to Wes, W7ZOI for his support.


Above — The Qu of this resonator at 112.3 MHz. I then measured and calculated Qu using the 3 dB method shown on November 11, 2014 and got 280 -- pretty close.

Above — A solid copper ground plane and connector holder eliminates any possible unwanted "capacitor" effects of FR4 board. The series resonator was soldered to the center of the copper wire at 1 end and ground at the other.
Best!
Qu or Unloaded Quality Factor in RF tuned circuits and filters can help with simulations and breadboards alike. I'll show an early attempt to measure crystal Qu. We enjoy a few methods for Q and Qu — enough, at least, to make it a fun challenge.
To preface, I recently bought my first non-home brew signal generator. It's old, but accurate, low noise, and freshly calibrated for I'm on a mission to run a 3 GHz bandwidth lab. A signal generator plus tracking generator/spectrum analyzer will serve as the main signal power measurement instruments as I move well above HF.
In part, wishing to improve my measurement techniques with this gear informed my choice of Qu measurement technique.
I examined a 4.0 MHz crystal from a batch of 10 "high quality, well matched crystals" purchased in 1996 from a reputable vendor from Germany. To my delight, I found 6 within ~10 Hz frequency and built a N=6, 500 Hertz wide CW filter with 0.1 dB ripple and an IL ~1 dB.
Here's the crystal motional L and C measures plus C0 of a remaining, unused crystal:
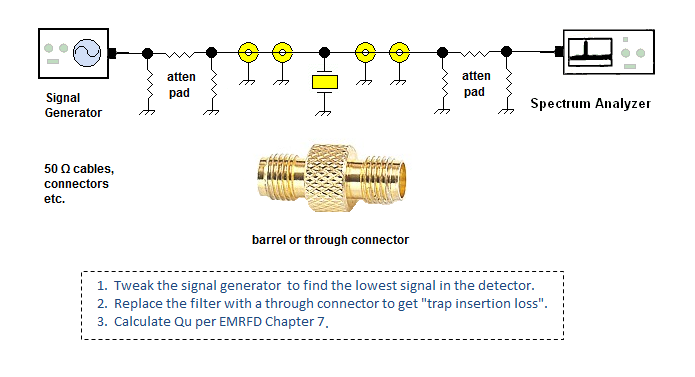
Above — The series trap set-up. You need a flat
amplitude versus frequency signal generator with 1 Hz tuning
resolution, plus a detector that can measure power/amplitude and
frequency in a narrow notch. I used a spectrum analyzer with a narrow
span + RBW to best pick off the trap or notch frequency.
The
crystal was soldered in a fixture and allowed to cool for 6 hours. I recorded the
power measure with the crystal in place, then substituted a through
connector to learn the crystal's attenuation at its series resonant
frequency,
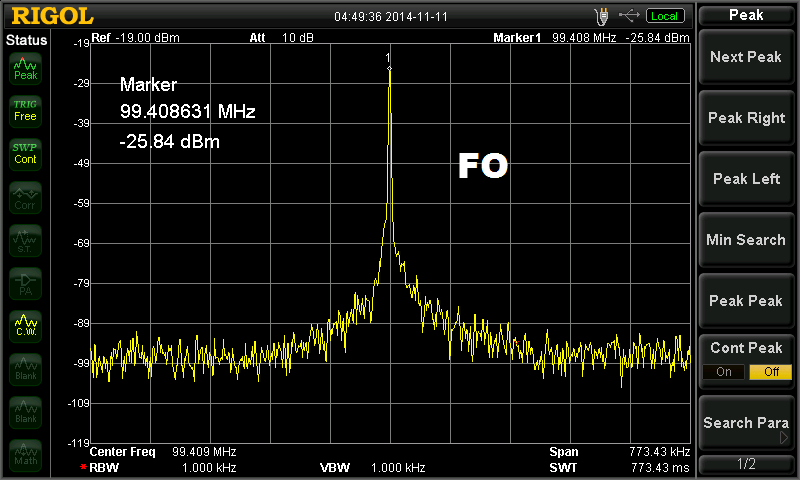
Above — I measured the attenuation of the notch as 9.46 dB and took equation 7.4 from EMRFD with Lm substituted for Lu. These are fabulous crystals and a Qu of ~275K explains why the IL was so low in my aforementioned narrow CW filter. I've got some glass encased crystals with a Qu of 720K in my parts collection. Now those are sweet.
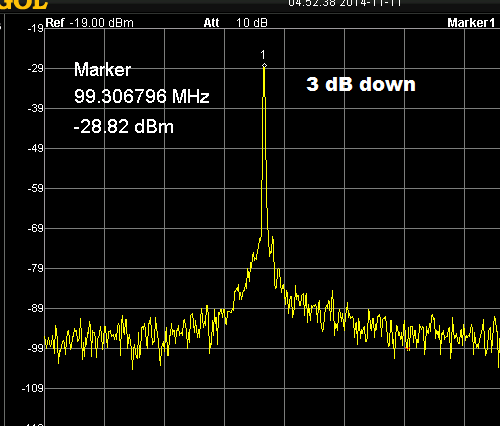
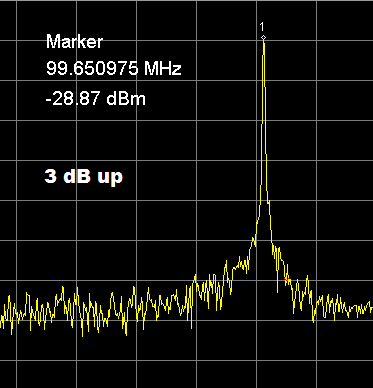
Above — As a lark, I tried to measure
Qu with a direct 3 dB method. Lots of attenuation made the measure
difficult and I'm not sure I've truly got Qu. Transformers would work
better, but I abandoned this little adventure since I'm happy with the series trap method. I'll also apply the trap technique to infer resonator Q at VHF for filter measures.
If you're building the Minima, I recommend viewing this page/site on the xtal filter and more by Steve, VK2SJA. He's got a link to a great crystal ladder filter summary by Nick Kennedy, WA5BDU and also applies the latest version of Dishal by Horst Steder, DJ6EV that embeds the work of Jack Hardcastle, G3JIR and he. Horst, DJ6EV link
Update:
Here's a quick Qu measurement of a resonator using the series trap method with a tracking generator and spectrum analyzer. Please see EMRFD Figure 7.66. A 96 nH heavy gauge Cu wire coil was soldered in series with a small air variable capacitor. I measured the resonator's attenuation at SRF after normalizing/zeroing the sweep system. I forgot to photograph the coil and cap in my fixture.
Above — The attenuation at the resonator's series resonant frequency.
Above — The Qu of this resonator at 112.3 MHz. I then measured and calculated Qu using the 3 dB method shown on November 11, 2014 and got 280 -- pretty close.
Best!


 50 Ω homebrew bench modules for test and measurement")


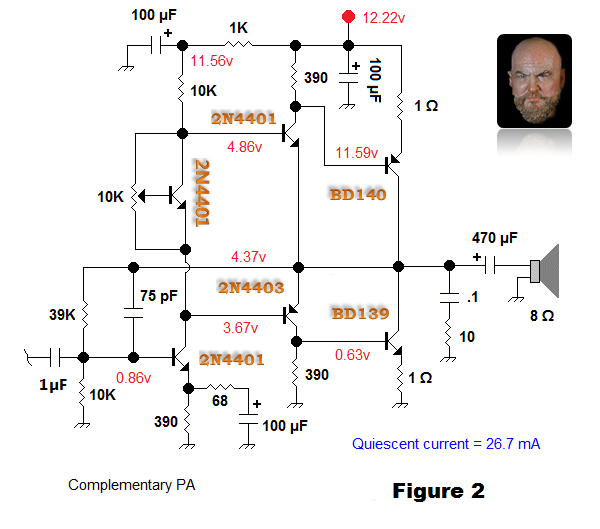
 with minimal cross-over distortion after adjusting the level shifter pot.")


.")


